Air Quality
Improving Access to Healthy Air for All
Improving Access to Healthy Air for All Air pollution is one of the most serious environmental threats to humans, as 90% of people are exposed to unhealthy air. Poor air quality impacts health and wellbeing, impedes student learning, decreases work productivity, and results in business disruption. Studies estimate exposure to air pollution increased COVID-19 deaths by 15% globally. To make matters worse, these challenges have disproportionately impacted low-income communities and people of color, resulting in environmental injustice. Enhanced air quality, on the other hand, supports sustainable cities and helps sustain economic growth. Actions that improve air quality can also reduce greenhouse gas emissions that cause climate change
Addressing the issue of air pollution on a global scale requires identifying solutions and taking action at a local level. The goal of Operation Healthy Air is to enable communities to mitigate exposure and improve poor air quality, by 1) educating people on the issue of air quality 2) increasing the amount of hyperlocal air quality data being collected and 3) providing the tools needed to take action.

Earthwatch’s Operation Healthy Air provides the tools and training needed to empower people to mitigate the exposure to poor air quality and take action to improve air quality. Air quality is a localized challenge, and Earthwatch’s participatory science model is best positioned to address a challenge at that level. Our experts bring this this invisible challenge into sharp focus for participants. Our educational curriculum increases participants’ understanding of what local air quality means for individuals, and for people living in communities most heavily impacted by poor air quality.
A major challenge has been the high cost of regulatory-level sensors. However, recent technological advances have produced low-cost sensors. Earthwatch is working with corporations, communities, and schools to deploy low-cost sensors to provide highly localized data in locations where the most vulnerable people are present. By monitoring air quality, we can predict, plan, and manage solutions to reduce exposure for those most vulnerable, and present the scientific data to decision makers to mitigate and improve their air quality.
This program is currently active in Boston and Springfield, Massachusetts; Delhi and Mumbai, India; Brussels, London, Madrid, and Paris. We envision a program operating in 20 global cities by 2025.
.
_white.svg.png?itok=d1c7AuOz)
Since 2003, nearly 400 Alcoa employees have contributed over 15,000 hours in support of Earthwatch's scientific research while also engaging in sustainability training. In 2020, the Alcoa Foundation began supporting Operation Healthy Air. In addition to education programs, eight Alcoa employees were selected to implement action plans with far-reaching community impacts.
.
Earthwatch launched Operation Healthy Air (OHA) in Southern California with funding from NASA to engage community members in assessing fluctuations in ozone and air temperature around their homes and test whether local landscaping (e.g. trees, gardens and parks) influences the well-being of their community.
Earthwatch expanded Operation Healthy Air (OHA) in 2019 into a more global program. We partner with local community members and institutions to better understand local air quality and to help take action to reduce exposure and emissions. Our programs include deploying low-cost PurpleAir Sensors to monitor particulate matter and using the Earth Challenge 2020 phone app to take snap shots of air pollution. We have active programs across the US in over 30 cities and focused community-based projects in Boston and Southern California as well as Delhi, India and Colombo, Sri Lanka.
Kids spend about six hours in school breathing the air inside and outside of the school facilities. Many schools and childcare centers in urban areas are near industrial facilities and high traffic roads. In addition, pollution sources such as idling buses, energy generation facilities, and chemicals in cleaning products can contribute to overall air pollution in schools. In order to tackle this problem, it is first necessary to understand and identify the sources of the air pollutants and, where and when they impact vulnerable populations of students. By monitoring air quality, schools can predict, plan, and manage solutions to reduce exposure for those most vulnerable, and to mitigate and improve the air quality in their centers. We are working with educators to help develop curriculum that incorporates real time sensor data about a phenomena of interest to students to increase student interest in science, environmental issues and social equity.
.
Read our "Engaging Schools with Air Quality Sensors" Case Study
.
Climate Change and Air Pollution
 Air quality issues are intimately related to climate change. Our resource-intensive lifestyles and systems generate climate-warming greenhouse gases and air pollutants that negatively affect human health. Today, our climate is warming at increased rates. One such culprit is a phenomenon known as the greenhouse effect. When greenhouse gases (think carbon dioxide, methane, etc.) are emitted, the sun’s heat gets trapped, which warms ground-level ozone. Furthermore, as temperatures continue to rise, it increases chemical reactions that accelerate this process. As the climate warms, the Earth experiences more extreme weather events, such as heat waves, droughts and wildfires that release black carbon into the atmosphere, again further warming the planet and undermining local air quality. The complex interaction between air pollution and climate change presents a major challenge for environmental protection efforts, but it also offers the potential for common solutions.
.
.
To learn more about Climate Change and Air Pollution, check out these links:
- United Nations Environment Program: “Air pollution and climate change: two sides of the same coin”
- US Centers for Disease Control and Prevention: “Climate Change Decreases the Quality of the Air We Breathe”
- University Corporation for Atmospheric Research: “Air Quality and Climate Change”
- US Environmental Protection Agency: “Air Quality and Climate Change Research”
.
.
Understanding Air Pollution
.
 Air pollution is ranked as one of the most serious environmental threats to human well-being. One type of air pollution is particulate matter (PM), a mixture of solid particles and liquid droplets in the air that come in a variety of sizes. PM 2.5, or particles 2.5 microns in size, are so small that they can be inhaled unknowingly and can cause serious health problems (fine PM pollution is responsible for millions of deaths annually). About 90% of people globally are exposed to unhealthy air and this exposure disproportionately impacts low-income communities and communities of color, which are more often located near pollution sources.
.
.
To learn more about Air Pollution and Particulate Matter, check out these links:
- US EPA: “Particulate Matter (PM) Basics”
- Natural Resources Defense Council: “Fossil Fuel Air Pollution Kills One in Five People”
- World Health Organization: “Air Pollution”
.
.
The Air Quality Index
An air quality index is used to report air quality around the world. Different countries use different air quality indices corresponding to different national air quality standards. The most commonly used index is the Air Quality Index (AQI) which was developed by the United States Environmental Protection Agency. The AQI, noted below, is divided into six categories indicating increasing levels of health concern.
AQI values that are at or below 100 are generally thought of as satisfactory. When AQI values are above 100, air quality is unhealthy.
|
Daily AQI Color |
Levels of Concern |
Values of Index |
Description of Air Quality |
|
Green |
Good |
0 to 50 |
Air quality is satisfactory, and air pollution poses little or no risk. |
|
Yellow |
Moderate |
51 to 100 |
Air quality is acceptable. However, there may be a risk for some people, particularly those who are unusually sensitive to air pollution |
|
Orange |
Unhealthy for Sensitive Groups |
101 to 500 |
Members of sensitive groups may experience health effects. The general public is less likely to be affected. |
|
Red |
Unhealthy |
151 to 200 |
Some members of the general public may experience health effects, members of sensitive groups may experience more serious health effects. |
|
Purple |
Very Unhealthy |
201 to 300 |
Health alert. The risk of health effect is increased for everyone. |
|
Maroon |
Hazardous |
301 and higher |
Health warning of emergency conditions: everyone is more likely to affected/ |
Several AQI systems exist around the world that each look at the concentration and corresponding health impacts. In Canada it’s called the Air Quality Health Index (AQHI), in Europe it’s called the Common Air Quality Index (CAQI), and China (mainland) and India both also calculated their own AQI.
.
.
To learn more about the Air Quality Index, check out these links:
- US EPA: “AQI Basics”
- PurpleAir Sensor Map: Real-time air quality map
- Air Quality standards in different countries: https://blog.atmotube.com/standards-for-air-quality-indices-in-different-countries-aqi/
.
.
Air Pollution and Human Health
.
Exposure to poor air quality is one of the most pressing threats to human health globally. Air pollution can lead to respiratory and heart conditions, which are both underlying health issues that have recently resulted in a significant increase in the risk of death from COVID-19.
Improving access to clean air depends on adopting practices that both reduce air pollution and help individuals to avoid polluted air. In order to achieve these objectives, it is critical to improve our ability to predict local air quality, especially in communities which are at the highest risk, and to take action to reduce emissions and avoid pollution exposure.
.
.

This map displays the variation in air quality within the Pittsburgh metro area. It shows that many communities with a high proportion of vulnerable community members, as defined by the EPA’s EJ Screening tool (the black outline), are located where air pollution is on average worse (red and orange colors) and fewer air sensors are located (green and orange triangles).
.
.
Environmental Racism and Environmental Justice
.
 Air pollution is ranked as one of the most serious environmental threats to human health and well-being. Yet low-income communities and communities of color are more often located near pollution sources, resulting in higher levels of exposure to unhealthy air. At the same time, climate change is predicted to have disproportionate impacts on low-income, marginalized communities. By participating in this program, you will have the opportunity to contribute to air quality research while developing strategies to reduce exposure to air pollution, particularly in vulnerable communities.
Environmental racism is a concept in the environmental justice movement, which developed in the United States throughout the 1970s and 1980s. Environmental racism is a form of systemic racism whereby communities of color are disproportionately burdened with health hazards through policies and practices that force them to live in proximity to sources of toxic waste such as sewage works, landfills and emitters of airborne particulate matter.
The US EPA defines Environmental Justice as the fair treatment and meaningful involvement of all people regardless of race, color, national origin, or income, with respect to the development, implementation, and enforcement of environmental laws, regulations, and policies.
.
.

.
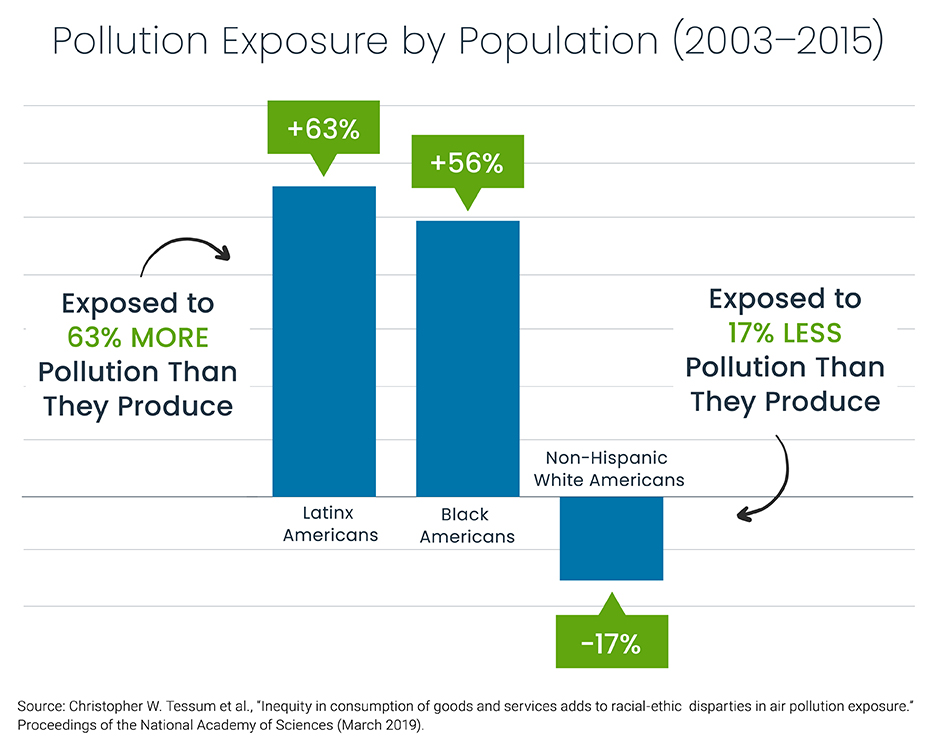
The image to the left was created from pollution exposure data by population from 2003 to 2015. It shows that Black and Latinx American populations are exposed to more pollution than they produce where non-Hispanic white Americans are exposed to less pollution than they produce. To read the full paper check out the link in the Learn More section.
.
.
.
To learn more about Environmental Racism and Environmental Justice, check out these links:
- Environmental Justice Screening and Mapping Tool: https://www.epa.gov/ejscreen
- Robert Bullard article: “I Wrote About This Environmental Injustice Decades Ago. It Hasn’t Changed.”
- Natural Resources Defense Council: “What is Environmental Justice”
- Columbia Law School’s Defending the Planet Podcast: “Environmental Justice”
- Julian Agyeman article: “Trends and Directions in Environmental Justice: From Inequity to Everyday Life, Community, and Just Sustainabilities”
- The New York Times article: “People of Color Breathe More Hazardous Air. The Sources Are Everywhere.”
- World Economic Forum article: “What is environmental racism and how can we fight it?”
- National Academy of Sciences article: "Inequity in consumption of goods and services adds to racial-ethic disparities in air pollution exposure.”
.
.
Exploring Air Quality Maps
.
Sample Air Quality Maps
Global Maps
- World Air Quality Index
(Beijing-based nonprofit) - Berkeley Earth Air Quality Map
- IQ Air Maps
North America
Central America
South America
Israel
- Israel Official Ministry of Environmental Protection AQ Map (more information here)
.
Success Stories
.
.
YOUR SUPPORT MATTERS
Earthwatch depends on donations—above and beyond what we raise from volunteers who participate on our expeditions—in order to deliver our global conservation mission. In fact, volunteer contributions provide only half of the total resources Earthwatch needs to sustain over 40 field research expeditions, a wide variety of educational programs, corporate sustainability trainings, and more each year.